Microsoft Excel Dynamic Dashboards for Management Reporting Training Course

Posted By : User Ref No: WURUR61299 0
  • Image
  • TypeTraining or Development Class
  • Image
  • Location Westlands Nairobi Kenya, Nairobi, Kenya
  • Price
  • Date 17-08-2020 - 21-08-2020
Microsoft Excel Dynamic Dashboards for Management Reporting Training Course, Westlands Nairobi Kenya, Nairobi, Kenya
Training or Development Class Title
Microsoft Excel Dynamic Dashboards for Management Reporting Training Course
Event Type
Training or Development Class
Training or Development Class Date
17-08-2020 to 21-08-2020
Last Date for Applying
14-08-2020
Location
Westlands Nairobi Kenya, Nairobi, Kenya
Organization Name / Organize By
FineResults Research Services
Organizing/Related Departments
Course Coordinator :FineResults Research Services
Organization Type
Organization
Training or Development ClassCategory
Both (Technical & Non Technical)
Training or Development ClassLevel
All (State/Province/Region, National & International)
Related Industries

Education/Teaching/Training/Development

Research/Science

Business Development

OTHERS

Location
Westlands Nairobi Kenya, Nairobi, Kenya

FineResults Research Services invites you to training on:

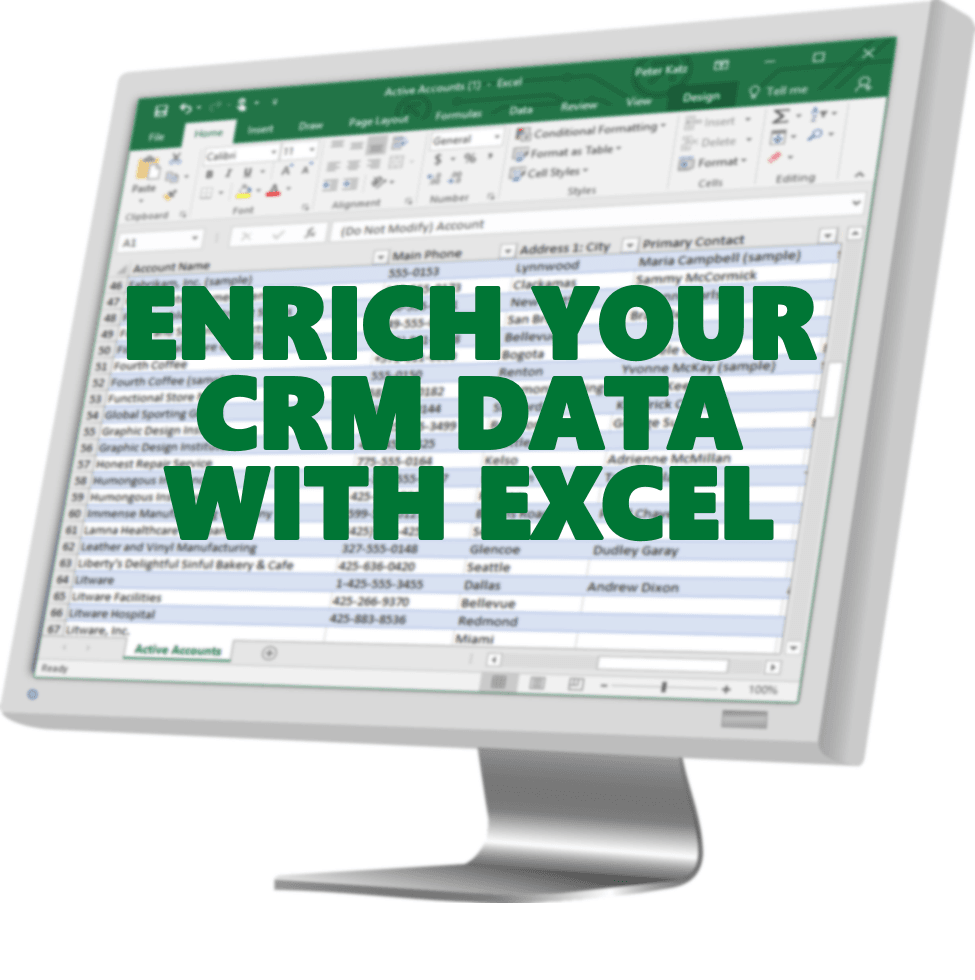
Topics: Microsoft Excel Dynamic Dashboards for Management Reporting

Date:    17th to 21st August 2020

Cost:      USD 800 or Ksh 65000

Contacts: +254 759 285 295, [email protected].

Venue    :  FineResults Research, Nairobi, Kenya Training Centre.

INTRODUCTION

Microsoft Excel Dashboards are reporting mechanisms that can deliver Business Intelligence (BI) in graphical form. Dashboards take raw data; allow it to be analyzed and presented in a form that is of most benefit to the end user.

The idea of information dashboards is to have the most important information such as KPIs presented within a single page that allows people to understand what is going on and make decisions.


DURATION

5 Days


WHO SHOULD ATTEND?

Accountants, senior and junior accountants, business analysts, accounting and finance professionals, research professionals, marketing and sales, administrative staff, supervisors, general business professionals and staff from any function who need to learn and apply state-of-the-art techniques to their daily business reporting, reconciliations, and analysis.


COURSE OBJECTIVES

At the end of this training course, participants will be able to:

  • Differentiate between Reports and dashboards
  • Discuss the benefits of an Excel dashboard
  • Assemble all data needed for a dashboard
  • Identify ground rules for creating effective dashboards
  • Show how to enable the Developer tab in Excel
  • Understand the Data Model
  • Create dynamic charts
  • Create Pivot tables
  • Create Pivot Charts
  • Modify Pivot tables and charts
  • Apply conditional formatting to a dashboard
  • Identify and apply Excel functions (IF, CHOOSE and VLOOKUP)
  • Design and build a dashboard from raw data to the finished product


TOPICS TO BE COVERED

Module 1: Introduction

Understanding Management Dashboards

  • What is a Dashboard?
  • Principles of Great Dashboard Design
  • Dashboard Do’s and Don’t’s


Working with your Data

  • Understanding Data Quality issues
  • Gathering data from different sources
  • Linking Data
  • Merging and Consolidating Data
  • Excel Hints and Tips when working with data


Module 2: Using Advanced Formulas & Functions in Excel 2010/2013

  • Referencing & Ranges
  • Advanced Lookup
  • Advanced Formatting


Analysing Data with Advanced Pivot Table Techniques in Excel 2010

  • Percentage
  • Computed Columns
  • Grouping & Sorting
  • Top Views
  • Multiple data sources
  • Using the dashboards with Excel Pivot Tables
  • Pivot Charts & Visual Dashboarding Techniques
  • Using external data sources such as The Web


Module 3: Advanced Power Charting Techniques

  • Thermometer Chart
  • Doughnut Chart
  • Pareto chart
  • Using Shapes to make Charts more attractive
  • Using Alerts to draw attention to dashboards


Creating Dynamic Dashboards with Excel 2010 / Excel 2013 for Management Reporting

  • Complete Management Dashboard for project KPIs
  • Complete Management Dashboard for Sales & Services
  • Best Practices in Dashboard Design
  • Versatile management dashboards
  • Dashboards Publishing Excel Dashboards to the Web


Module 4: Dashboard Macros

  • Simple & Complex Macros
  • Dynamic Dashboards using Macros


Module 5: Building Your Own Dashboard

  • This last session will be used to build some relevant Dashboards. Delegates are encouraged to bring examples of the dashboarding they would like to create during the training.


NB: We are offering you a half day, fun and interactive team building event!


Be part of the Training

  • Click HERE for the individual registration.


Engage with us on  

Visit our face book page

Visit our linkedin page  

Visit our twitter account


Others Details

Microsoft Excel Dashboards are reporting mechanisms that can deliver Business Intelligence (BI) in graphical form. Dashboards take raw data; allow it to be analyzed and presented in a form that is of most benefit to the end user. The idea of information dashboards is to have the most important information such as KPIs presented within a single page that allows people to understand what is going on and make decisions.

Registration Fees
Available
Registration Fees Details
usd 800
Registration Ways
Email
Phone
Website
Address/Venue
  FineResults Research, Nairobi, Kenya Training Centre.  Pin/Zip Code : Nairobi kenya
Official Email ID
Contact