Organization Name / Organize By
Compliance Global Inc.
Organizing/Related Departments
Compliance Global Inc.
Organization Type
Organization/Company
WebinarCategory
Both (Technical & Non Technical)
WebinarLevel
All (State/Province/Region, National & International)
Related Industries
Business Development
Finance
Location
New York, United States
Overview
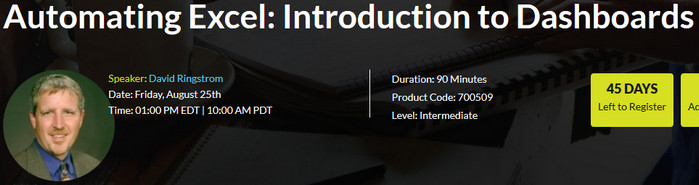
In this enlightening webinar, Excel expert David H. Ringstrom, CPA, introduces you to Microsoft Excel worksheet dashboards.
David typically teaches from Excel 2016, but he points out any differences in earlier versions of Excel. He’s also happy to demonstrate techniques in a specific version of Excel spreadsheet upon request. David’s detailed handouts serve as reference tools you can fall back on after participating in one of his webinars. He also provides an Excel dynamic dashboard workbook that includes a majority of the examples he uses during this webinar.
Why Should You Attend
Learn a variety of techniques for presenting Excel data in dashboard form and how to quickly assimilate large amounts of data within charts and summary tables.
David's courses are fast-paced, and attendees often are surprised at the amount of ground he covers in a webinar. He welcomes participants' questions, so come ready to pick his brain.
David's materials cover Excel 2016, 2013, 2010, and 2007. He typically demonstrates techniques by using Excel 2013 or 2016, but is able to perform live demonstrations upon request in Excel 2010 and 2007 as well.
Areas Covered in this Webinar
- Create a dashboard that looks less like an Excel spreadsheet by hiding screen elements
- Create dynamic and interactive graphs with Excel’s PivotChart feature
- Discover how Microsoft Query allows you to create self-updating links to databases, spreadsheets, text files, and other data sources
- Filter data faster by way of the Slicer feature in Excel 2010 and later
- Learn how to control multiple pivot tables and charts instantly with the Slicer feature in Excel 2010 and later
- Learn how to hide or unhide Excel’s Ribbon interface using a simple macro technique
- Learn why certain features, including slicers, sparklines, and charts, are disabled in some workbooks
- Switch between Custom Views by way of a hidden drop-down list you can enable on Excel's Quick Access Toolbar
- Understand why features, such as Slicers, are disabled in certain workbooks
- Use Excel’s Custom Views feature to make a single set of data serve multiple purposes
- Use Excel’s PivotTable feature to condense large amounts of information into manageable chunks
- Use the Group and Ungroup feature to expand or collapse rows and/or columns
Learning Objectives
- Identify ways to use Excel dashboards to quickly assimilate large amounts of data
- Recall how to create a dashboard that looks less like an Excel spreadsheet
- Define how to create dynamic and interactive graphs with Excel’s PivotChart feature
Who Will Benefit
- Accountants
- CPAs
- CFOs
- Controllers
- Financial and Business professionals
- IT/business intelligence consultants
- Practitioners tasked with summarizing large amounts of data in Microsoft Excel spreadsheets
Email: [email protected]
Toll Free: +1-844-746-4244
Tel: +1-516-900-5515
Fax: +1-516-900-5510
Others Details
Bringing data into Excel worksheet using dashboard in Excel and use of Excel’s PivotTable feature to condense data
Registration Fees
Available
Registration Fees Details
Live Session
for one participant
$159
Corporate Live Session
Group - Max 10 Participants from one Location.(For multiple location please contact our customer support team)
$449
Recorded Session
Get unlimited access to the webinar recording link for six months
$199
Training CD
Free shipment within 72 Hours, from the date of purchase
$379
Registration Ways
Email
Phone
Website
Post Box
Other