Use Microsoft Excel Pivot Tables to Easily Summarize and Analyze Data

6 years ago Posted By : User Ref No: WURUR22689 0
  • Image
  • TypeWebinar
  • Image
  • Location Denver, Colorado, United States
  • Price
  • Date 18-07-2018
Use Microsoft Excel Pivot Tables to Easily Summarize and Analyze Data, Denver, Colorado, United States
Webinar Title
Use Microsoft Excel Pivot Tables to Easily Summarize and Analyze Data
Event Type
Webinar
Webinar Date
18-07-2018
Last Date for Applying
18-07-2018
Location
Denver, Colorado, United States
Organization Name / Organize By
Training Doyens
Organizing/Related Departments
Training Doyens
Organization Type
Organization/Company
WebinarCategory
Both (Technical & Non Technical)
WebinarLevel
All (State/Province/Region, National & International)
Related Industries

Business Development

Finance

Accounting/Financial/Banking/Insurance

Location
Denver, Colorado, United States

OVERVIEW

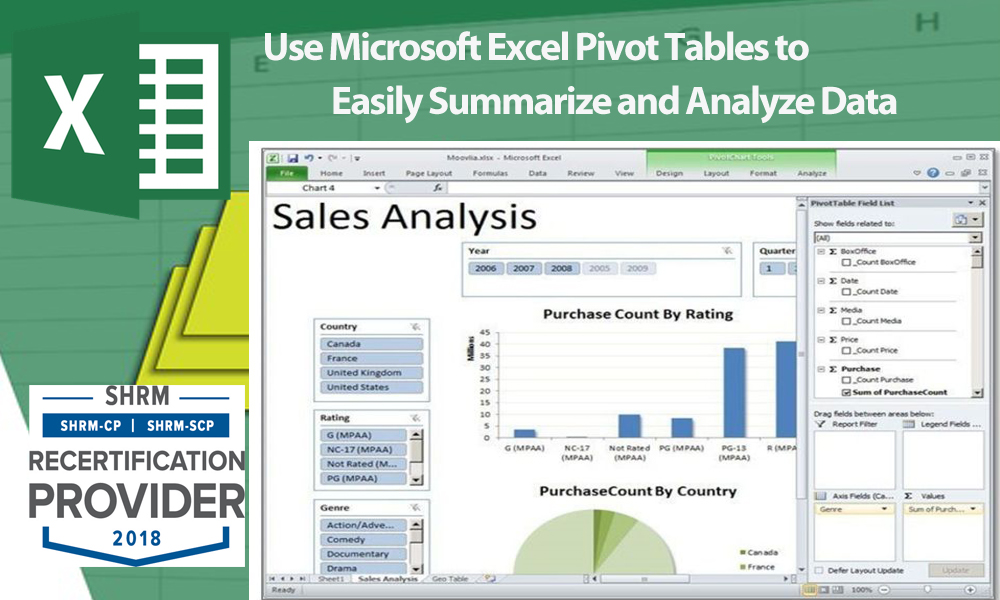
PivotTables can help you sort and sift through large data sets to focus quickly on just the data elements that matter most to your specific needs.In addition, you’ll get tips on the easiest way to group your data. Most importantly, when you use the power of PivotTables, you’ll be saving time and making your job easier.

WHY SHOULD YOU ATTEND

Attend the webinar to get an in-depth knowledge of PivotTables, including how the tool helps in making customized reports and how it helps in making better business decisions.

AREAS COVERED

  • Why PivotTables are the hidden gems of Excel
  • How to analyze large data sets from different business perspectives
  • Create a PivotTable to summarize data
  • Make understanding the data easier for others
  • Use PivotTables to answer questions about the data
  • Analyze patterns in the data
  • Customize the summary by grouping data
  • Format PivotTables for easy viewing
  • Use a chart to view the summary visually

LEARNING OBJECTIVES

In just one fast-paced and informative training session, you’ll learn how to use PivotTables better to sort, filter and subtotal your data more efficiently ... create multiple customized reports in a few easy steps ... and gain a powerful new tool to help you make better business decisions.

WHO WILL BENEFIT

  • Administrative assistants
  • Managers
  • Directors
  • Sales associates
  • Students
  • Teachers
  • Marketing personnel
  • Medical personnel
  • Legal professionals

Anyone using MS Office in a business or educational setting to analyze data and create reports.


For more detail please click on this below link:

https://bit.ly/2JNxH6W


Email: [email protected]

Toll Free: +1-888-300-8494

Tel: +1-720-996-1616

Fax: +1-888-909-1882

Others Details

Get an in-depth knowledge about Microsoft Excel Pivot Tablesand learn how to make customized reports using the tool. Also learn how to analyse patterns of data.

Registration Fees
Available
Registration Fees Details
Live Session for one participant $159 Corporate Live Session Group – Max 10 Participants from one location. $449 Recorded Session Get unlimited access to audio recording of the webinar for 6 months. $199 Training DVD or USB Flash Drive Free shipment within 72 Hours, from the date of webinar completion $379 Super Combo Offer 1 Live and Recorded webinar $289 Super Combo Offer 2 Live and Training DVD / USB Flash Drive $429
Registration Ways
Email
Phone
Website
Other
Address/Venue
  26468 E Walker Dr, Aurora, Colorado 80016  Pin/Zip Code : 80016
Landmark
CO
Official Email ID
Contact
Training Doyens

26468 E Walker Dr, Aurora, Colorado 80016

[email protected]

   8883008494
Michael smith

26468 E Walker Dr, Aurora, Colorado 80016

[email protected]

   8883008494    Fax No: Aurora